Is Anthropic worth $1.4 trillion? No advice, just the math: at $78 it needs Google-size revenue
Anthropic at $70 to $78, about $1.4T: under cautious assumptions, 10% a year from $78 needs Google-size revenue by 2030. Plus four futures and a cheat sheet.
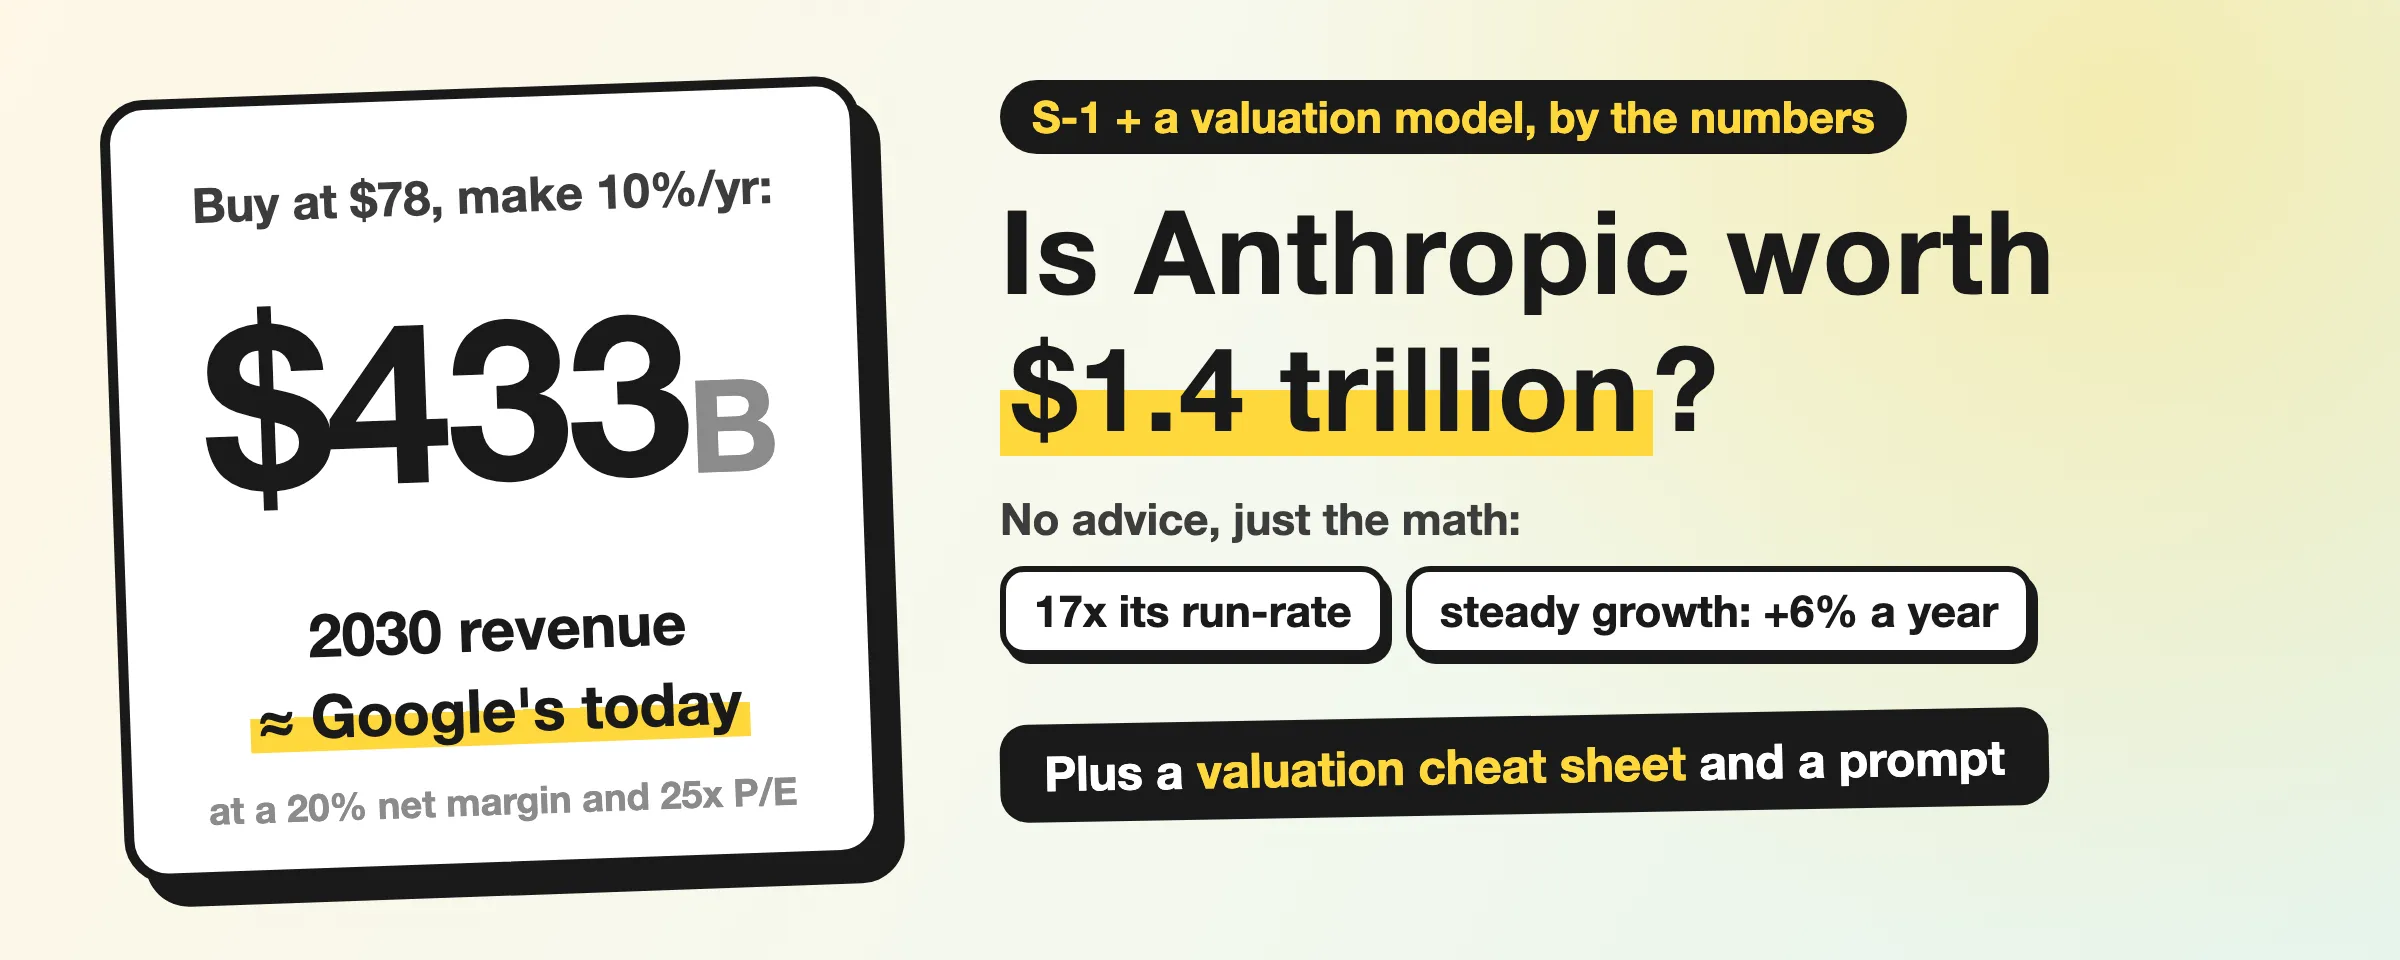
On November 10 Anthropic set its IPO range at $70 to $78 a share. At $78, fully diluted, that is a $1.40 trillion valuation, 17 times its October revenue run-rate.
I won’t tell you whether to buy. I ran the math backward instead. Buy at the $78 IPO price and want 10% a year through the end of 2030? With a cautious 20% net margin and a 25x P/E, Anthropic needs about $433 billion of revenue in 2030, close to what Alphabet makes in a year today ($471 billion). If the stock opens 50% higher and you pay $117, it needs $649 billion, 1.4 Alphabets.
Data as of November 10: Anthropic’s second amended prospectus (S-1/A No. 2), filed that day, and that day’s closing prices for the comparison companies.
Inside:
- Price to valuation: what each price from $70 to $131 means in market value and revenue multiples.
- A P/E of sorts: at its Q3 operating margin, $78 works out to 116 times earnings.
- The math backward: the 2030 revenue it needs for you to break even, make 10% or make 15% a year, and which company makes that much today.
- Four futures: price war, stall, steady, runaway. In the steady one revenue reaches Nvidia’s size today, and buying at $78 still earns only 6% a year.
- The $900 billion compute bill: why the low-revenue futures can hardly have high margins.
- To keep: the dates to watch, a cheat sheet, and an AI prompt that reruns everything once you plug in the final price and the open.
1. Turn the share price into a valuation
The price is set on November 18 (per media reports), and nobody knows the open, so I ran six prices: $70, $74 and $78 from the range, plus opens 20%, 50% and 68% above a $78 IPO price. The 68% is Cerebras’s first-day close against its IPO price in May, used only as an example.
| Price | Market cap, shares outstanding | Market cap, fully diluted | Minus cash (EV) |
|---|---|---|---|
| IPO at $70 | $917B | $1.26T | $1.05T |
| IPO at $74 | $968B | $1.33T | $1.12T |
| IPO at $78 | $1.02T | $1.40T | $1.19T |
| Opens +20% ($93.60) | $1.22T | $1.68T | $1.47T |
| Opens +50% ($117) | $1.53T | $2.11T | $1.89T |
| Opens +68% ($131) | $1.71T | $2.36T | $2.14T |
As multiples of revenue:
| Price | Fully diluted ÷ run-rate | EV ÷ run-rate | EV ÷ (Q3 revenue × 4) | EV ÷ trailing 12-month revenue |
|---|---|---|---|---|
| IPO at $70 | 15.6x | 13.0x | 15.5x | 29.8x |
| IPO at $74 | 16.5x | 13.8x | 16.5x | 31.8x |
| IPO at $78 | 17.3x | 14.7x | 17.5x | 33.7x |
| Opens at $93.60 | 20.8x | 18.1x | 21.7x | 41.6x |
| Opens at $117 | 26.0x | 23.3x | 27.9x | 53.6x |
| Opens at $131 | 29.1x | 26.5x | 31.6x | 60.7x |
The three revenue figures:
- Run-rate, $81 billion: the company’s own metric. Usage fees from the 28 days to October 31 times 13, plus monthly subscriptions times 12. It is a snapshot of the pace on one day, not a year of revenue. At the end of September it was $71 billion, so it added $10 billion in a month.
- Q3 revenue times 4, $67.8 billion: Q3 revenue was $16.96 billion.
- Trailing 12-month revenue, $35.3 billion: Q4 2025 through Q3 2026.
The $1.02 trillion and $1.40 trillion in the headlines are both right; the difference is the share count. $1.02 trillion is the roughly 13.1 billion shares outstanding after the IPO and the private placement (Class A plus Class N) times $78. $1.40 trillion uses the roughly 18.0 billion fully diluted shares. The extra 4.9 billion are employee options (1.71 billion, net of the shares the exercise money buys back), unvested restricted stock (1.07 billion), Amazon’s convertible notes that can’t convert yet because of its 12% ownership cap (1.56 billion), and donation-matching shares (0.58 billion). Those shares will come out and claim the same pie, so this piece uses fully diluted throughout. That is 38% more than the outstanding count, or $385 billion at $78.
EV is the fully diluted value minus the cash and short-term investments on hand after the IPO, about $215.9 billion at a $78 price. The three open rows use the share count and cash from a $78 IPO price: however high the stock opens, the company gets the same money. For comparison, May’s Series H works out to $58.90 per share; $78 is 32% above it.
2. A P/E of sorts
Under GAAP, Anthropic lost $104.0 billion in the first nine months, so there is no P/E. But $94.3 billion of that (91%) is a paper loss from re-pricing early convertible notes at the new valuation, not cash out the door. The operating loss was just $1.26 billion, and operating cash flow was a positive $6.6 billion.
So I used a different yardstick: assume the October run-rate holds for a year, multiply by a margin to get hypothetical earnings, and divide the fully diluted value by that. 15% is the Q3 adjusted operating margin; Q2’s was 19%. That is an operating margin, before stock compensation and taxes, so net income would be lower.
| Buy price | 15% margin | 20% margin | 30% margin |
|---|---|---|---|
| $78 | 116x | 87x | 58x |
| $117 (opens +50%) | 173x | 130x | 87x |
The others, at the November 10 close, on trailing 12 months:
| Company | Market cap | P/S | P/E |
|---|---|---|---|
| Anthropic ($78) | $1.40T | 39.8x (17.3x on run-rate) | loss |
| Nvidia | $4.31T | 14.2x | 22.5x |
| Microsoft | $3.96T | 11.4x | 27.8x |
| Alphabet | $3.50T | 7.4x | 14.7x |
| Amazon | $2.93T | 3.7x | 21.6x |
| Meta | $1.64T | 6.8x | 21.6x |
| Palantir | $389B | 53.4x | 110.3x |
| OpenAI (reported) | $1.25T | 25x (on annualized revenue) | no data |
Three takeaways:
- At its Q3 margin, $78 works out to 116 times earnings. That is on operating profit, before taxes and stock compensation; Palantir’s 110 is on net income, so the bases differ and only the order of magnitude compares. Even at a 30% margin it is 58 times, about two and a half times Nvidia’s.
- On run-rate, 17.3 times sales sits between Nvidia’s 14.2 and OpenAI’s 25; on trailing revenue, the basis of Nvidia’s figure, it is 39.8. OpenAI’s $1.25 trillion valuation and roughly $50 billion of annualized revenue are both media reports, and the two companies don’t count revenue quite the same way.
- Alphabet’s and Amazon’s P/Es are flattered by investment gains, so compare with them on sales. Amazon booked $62.8 billion of pre-tax gains from marking up Anthropic in the first nine months (Amazon’s 10-Q). Alphabet’s other income for the first nine months was $100.9 billion higher than a year earlier, and its 10-Q says the rise came mainly from unrealized gains “largely from a private company” and SpaceX before its IPO. That the private company is Anthropic is my inference.
3. The math backward: how much it has to sell in 2030
Five steps:
- The end-2030 share price you want = buy price × (1 + yearly return) to the power of 4.1. November 19 to the end of 2030 is 4.1 years.
- Shares in 2030: 18.0 billion fully diluted, which I grow 1% a year, about 18.75 billion by 2030. This is an illustrative number: stock compensation expense was $3.26 billion in the first nine months, about 0.3% of the $78 market value a year; restricted stock granted after the end of September comes to about 2% a year. Section 6 shows the result at 3%.
- Market value needed in 2030 = share price × shares.
- Market value = 2030 net income × P/E, and net income = revenue × net margin. Run it backward to get the revenue.
- Today’s cash is not added back: I assume it all goes to compute (see section 5). If none of it is spent, the revenue needed for 10% a year from $78 drops from $433 billion to about $390 billion.
Two lenses. Cautious: 20% net margin, 25x P/E, so each $1 of revenue is worth $5 of market value. Upside: 30% net margin, 30x P/E, so $9.
| Buy price, return you want | 2030 share price | Cautious: revenue needed | Upside: revenue needed |
|---|---|---|---|
| $78, break even | $78 | $293B, about Nvidia | $163B, two-thirds of Meta |
| $78, 10% a year | $115 | $433B, close to Alphabet | $241B, about Meta |
| $78, 15% a year | $139 | $520B, 1.1 Alphabets | $289B, close to Nvidia |
| $117, break even | $117 | $439B, close to Alphabet | $244B, about Meta |
| $117, 10% a year | $173 | $649B, 1.4 Alphabets | $361B, about Microsoft |
| $117, 15% a year | $208 | $780B, about Amazon | $433B, close to Alphabet |
Revenue today (trailing 12 months): Meta $242 billion, Nvidia $303 billion, Microsoft $346 billion, Alphabet $471 billion, Amazon $797 billion. These are for scale only; the businesses are very different.
The part most people miss is the gap between the IPO price and the open: buying at a $117 open and merely breaking even by 2030 takes about the same revenue as buying at $78 and making 10% a year. Only people who get an allocation pay the IPO price. Most buy after the open, from a higher starting point. I covered the three day-one prices in the earlier piece.
4. Four futures
I drew four revenue paths from a 2026 base of about $53.5 billion: $33.24 billion of actual revenue in the first nine months, plus a fourth quarter of $20.25 billion if the October run-rate stops rising (my estimate). The four are not equally likely, and I don’t assign odds.
- Price war: rivals cut prices and the revenue pace falls from here. 2027 as a full year still beats 2026 but is already below today’s run-rate, and it keeps sliding after that. About $59.9 billion in 2030, 80% of Oracle’s revenue today ($71.8 billion).
- Stall: doubles in 2027, then grows just over 10% a year. About $150 billion in 2030, 60% of Meta.
- Steady: growth halves every year. About $300 billion in 2030, roughly Nvidia today.
- Runaway: growth stays high. About $601 billion in 2030, 1.3 Alphabets.
Year by year:
| Future | 2027 | 2028 | 2029 | 2030 | Yearly growth from run-rate |
|---|---|---|---|---|---|
| Price war | $72.2B | $65.0B | $61.7B | $59.9B | −8% |
| Stall | $107B | $120B | $134B | $150B | +18% |
| Steady | $121B | $197B | $259B | $300B | +43% |
| Runaway | $139B | $250B | $401B | $601B | +73% |
I set margin and P/E by path: the lower the revenue, the lower the margin I give it (section 5 explains why), and the slower the growth, the lower the multiple.
| Future | Net margin × P/E | 2030 share price | Bought at $78 | Bought at $117 |
|---|---|---|---|---|
| Price war | 10% × 20 | $6 | −92%, −46% a year | −95%, −51% a year |
| Stall | 15% × 20 | $24 | −69%, −25% a year | −79%, −32% a year |
| Steady | 25% × 25 | $100 | +28%, +6% a year | −15%, −4% a year |
| Runaway | 30% × 30 | $288 | +270%, +37% a year | +146%, +25% a year |
In the steady future, 2030 revenue is 5.6 times 2026’s and catches up with Nvidia today, yet buying at $78 earns only 6% a year, and buying at a $117 open loses money. The big returns need the runaway path.
5. The $900 billion compute bill
The prospectus lists about $900.9 billion of commitments, nearly all compute and infrastructure. About $451.6 billion of it falls between October 2026 and the end of 2030. The table with fixed yearly amounts covers only $320.0 billion, with $121.3 billion due in 2027 through 2029: treat that as the floor. The filing also lists $150 to $175 billion of arrangements with no fixed dollar amount that are not in the $900.9 billion.
| Future | Revenue 2027–2029 | Fixed-table bill ÷ revenue | Revenue Q4 2026–2030 | $451.6B ÷ revenue |
|---|---|---|---|---|
| Price war | $199B | 61% | $279B | 162% |
| Stall | $361B | 34% | $532B | 85% |
| Steady | $577B | 21% | $897B | 50% |
| Runaway | $790B | 15% | $1.41T | 32% |
The bill is mostly fixed; revenue isn’t. In Q3, compute and infrastructure already ate 58% of revenue. In the price war, commitments through 2030 run 60% above revenue over the same period. Of the $900.9 billion, $186.2 billion carries termination rights or conditions; even if all of it fell before 2031 and all of it were cancelled, the bill would still be 95% of revenue. The 10% net margin I gave the price war is already generous.
Flip it around and the same bill gets spread thinner as revenue grows. That makes margin the knob that matters most, and it likely moves with revenue: when revenue disappoints, a high margin is hard to reach. These ratios show the pressure to pay, not the margin: when a bill is paid and when it is booked as an expense differ, and the margins in the four futures are my assumptions, only informed by this table.
6. Which assumption moves the answer most
Take the steady path (about $300 billion of 2030 revenue) and change only the net margin and the P/E. The cells show the 2030 share price, with the yearly return from $78 in brackets:
| Net margin \ P/E | 20x | 25x | 30x | 35x |
|---|---|---|---|---|
| 15% | $48 (−11%) | $60 (−6%) | $72 (−2%) | $84 (+2%) |
| 20% | $64 (−5%) | $80 (+1%) | $96 (+5%) | $112 (+9%) |
| 25% | $80 (+1%) | $100 (+6%) | $120 (+11%) | $140 (+15%) |
| 30% | $96 (+5%) | $120 (+11%) | $144 (+16%) | $168 (+20%) |
| 35% | $112 (+9%) | $140 (+15%) | $168 (+20%) | $196 (+25%) |
Between 0% and 3% a year, share count moves the answer less than margin or P/E; if it pays for compute by issuing a lot of stock, dilution will be bigger. At a 25% margin and 25x P/E:
| Dilution a year | Extra shares by 2030 | 2030 share price | Yearly return from $78 | Yearly return from $117 |
|---|---|---|---|---|
| 0% | 0 | $104 | +7% | −3% |
| 1% | 4.2% | $100 | +6% | −4% |
| 3% | 12.9% | $92 | +4% | −6% |
One step in margin or P/E changes the yearly return by 4 to 7 points; going from 1% to 3% dilution changes it by 2. Here is where each risk lands:
- Compute commitments move the margin. That is the bill in section 5.
- A price war moves revenue and margin together. The prospectus says open-weight models released by organizations at home and abroad compete for cost-sensitive workloads and could push prices down.
- Revenue mix moves the multiple. 79% is usage-based, so customers who use less pay less; the top five customers were about 25% of revenue in the first nine months; and 44% came through cloud providers’ marketplaces. The less steady the revenue, the lower the multiple the market tends to pay.
- Governance moves the multiple. Public Class A shares carry at most 49.9% of the votes combined, the Long-Term Benefit Trust elects a majority of the board, and as a public benefit corporation the company balances shareholders against its mission. If the market discounts that, the discount lands on the multiple.
- Stock compensation and new shares move value per share. If it sells stock to pay for compute at 3% a year, there are 12.9% more shares by 2030.
7. What to watch
| Date | What happens | What it tells you |
|---|---|---|
| Nov 18 | Pricing (media report) | Each extra $1 of IPO price adds about $18 billion of fully diluted value |
| Nov 19 | First trade (media report) | However far the open is above the IPO price, the 2030 revenue you need rises by the same proportion; see section 8 |
| Mon Dec 21, at the open | Under Nasdaq’s fast-entry rule since May, a November 19 listing has its 7th trading day on November 30, the reference date for the annual reconstitution. If it ranks in the top 40 by market value that day, it joins the Nasdaq-100 with the December reconstitution, announced after the close on December 11. If the listing slips a day, entry moves to at least five trading days after December 21 (my count from the rules) | Index funds buy in a short window |
| Early 2027, date not set | First earnings report as a public company (Q4 2026). Up to about 1.7 billion shares can be sold early from the second full trading day after those results | Whether the run-rate is still climbing, and whether the adjusted operating margin is back at 19% or below 15%. This is the most sensitive number in section 6 |
| Mid-May 2027 | The second full trading day after Q1 results, or day 180 (May 17), whichever comes first: employees, officers and holders of about 2.7 billion shares unlock; about 8.0 billion more and the founders wait for Q3 2027 results or day 365. Around May 20 the $26 billion of placement shares turn six months old, and holders who aren’t affiliates can sell under Rule 144 | Many more shares can be sold |
The full unlock calendar is in the earlier piece.
8. Cheat sheet (bookmark this)
Cautious lens (20% net margin, 25x P/E), for 10% a year through the end of 2030:
| Your buy price | Fully diluted value | EV ÷ run-rate | 2030 revenue needed | Today, that is |
|---|---|---|---|---|
| IPO at $70 | $1.26T | 13.0x | $389B | 1.1 Microsofts |
| IPO at $74 | $1.33T | 13.8x | $411B | 0.9 Alphabets |
| IPO at $78 | $1.40T | 14.7x | $433B | close to Alphabet |
| Opens at $93.60 | $1.68T | 18.1x | $520B | 1.1 Alphabets |
| Opens at $117 | $2.11T | 23.3x | $649B | 1.4 Alphabets |
| Opens at $131 | $2.36T | 26.5x | $727B | 0.9 Amazons |
The open rows assume a $78 IPO price.
9. A prompt to paste into an AI
After pricing and the open, fill in three numbers (if the number of shares offered hasn’t changed) and paste this into an AI that can run code (Claude or ChatGPT). It redoes the tables in sections 1, 3 and 4 the same way:
Recompute the valuation tables for Anthropic (ticker ANT). Use only the numbers below; do not look anything up or change a number from memory. Compute with code and show the formulas. No buy or sell advice.

My three numbers:
- Final IPO price P_ipo = ____ dollars
- First-day opening price P_open = ____ dollars
- Latest run-rate R0 = ____ billion dollars (the company's Run-Rate Revenue; $81B on 2026-10-31)

Fixed inputs (Anthropic S-1/A Amendment No. 2, 2026-11-10):
- At a $74 IPO price: shares outstanding 13,086,672,591; fully diluted 18,012,993,381.
- The $26.0B private placement buys shares at the IPO price: 351,351,348 shares at $74. At another price, add ($26.0B / P_ipo - 351,351,348) to both counts.
- Options use the treasury method: at $74 the exercise money buys back 69,774,828 shares. Also subtract (69,774,828 x 74 / P_ipo - 69,774,828) from the fully diluted count.
- Cash and short-term investments after the IPO: $212.684B at $74, plus $0.793B for each $1 above $74.
- These share counts and cash hold only if the shares offered (825 million) and the placement ($26.0B) stay the same; if either changes, update them from the final prospectus.
- Q3 2026 revenue $16.956B; trailing 12-month revenue $35.282B; first nine months of 2026 $33.242B.
- Holding period t = years from the first trading day to 2030-12-31 (4.115 for a November 19 listing).
- Dilution 1% a year: 2030 shares = fully diluted shares x 1.01^t.
- 2030 market value = revenue x net margin x P/E. Today's cash is not added back (assumed spent on compute).
- Two lenses: cautious = 20% net margin, P/E 25; upside = 30% net margin, P/E 30.
- Revenue today, for scale: Meta $241.6B, Nvidia $303.0B, Microsoft $346.4B, Alphabet $471.1B, Amazon $797.4B.

Table 1, price to valuation: rows = P_ipo, P_open, and P_ipo x 1.2, x 1.5, x 1.68. Columns = market cap on shares outstanding, fully diluted market cap, EV (fully diluted minus cash), fully diluted / R0, EV / R0, EV / (Q3 revenue x 4), EV / trailing 12-month revenue. Share counts and cash always use P_ipo; the open only changes the market value.

Table 3, the math backward: buy price = P_ipo and P_open; yearly return = 0%, 10%, 15%. 2030 revenue needed = buy price x (1 + return)^t x 2030 shares / (net margin x P/E), one column per lens, each with the closest company and the ratio.

Table 4, four futures: 2026 revenue = $33.242B + R0 / 4 (use the actual 2026 figure once it is reported). Growth each year after that:
- Price war: +35%, -10%, -5%, -3%; net margin 10%, P/E 20
- Stall: +100%, +12%, +12%, +12%; net margin 15%, P/E 20
- Steady: +126%, +63%, +31.5%, +15.75%; net margin 25%, P/E 25
- Runaway: +160%, +80%, +60%, +50%; net margin 30%, P/E 30
Output revenue for 2027-2030, the 2030 share price (2030 market value / 2030 shares), and the total and yearly return from P_ipo and from P_open.

Finish with three sentences: at this open, how much 2030 revenue a 10% yearly return needs; which of the four futures make money; and how this compares with the 2026-11-10 version ($78 IPO price: $1.40T fully diluted, $433B of 2030 revenue for 10% a year).
10. How I worked it out
Sources:
- Anthropic: share counts, cash, revenue, profit and compute commitments come from the second amended prospectus, filed November 10. Q3 and nine-month figures are unaudited.
- Dates: the pricing and first-trade dates are from CNBC, citing people familiar with the matter; the company hasn’t confirmed them. The Nasdaq-100 fast-entry rule is from Nasdaq’s methodology and Callan.
- Comparison companies: market cap, P/E and P/S at the November 10 close are from FMP; trailing revenue is market cap divided by P/S, except Alphabet’s, which is from its filings. The investment gains are from Amazon’s and Alphabet’s Q3 10-Qs.
- OpenAI: Bloomberg first reported the $1.25 trillion valuation (via TechCrunch); roughly $50 billion of annualized revenue at the end of September was reported by the Financial Times (relayed by Bloomberg Law, anonymous sources). Both are media reports; OpenAI hasn’t confirmed either.
Assumptions:
- Share counts move with the IPO price: the $26 billion placement converts at the IPO price, and options are netted by the treasury method, which puts $78 at $1.404 trillion. The open rows use the share count and cash from a $78 IPO price.
- Holding period 4.115 years, from November 19, 2026 to the end of 2030. Dilution 1% a year, with 0% and 3% shown too.
- 2030 value = that year’s net income × P/E. Today’s cash is not added back, on the assumption it all goes to compute. If none of it is spent by 2030, every future’s share price is about $11.50 higher: the steady one comes to $111, 9% a year rather than 6%, and the revenue needed for 10% a year from $78 drops from $433 billion to about $390 billion.
- Q4 2026 revenue = the October run-rate ÷ 4, my estimate. The four revenue paths and their margins and P/Es are my choices.
- Yearly growth from the run-rate spans end of October 2026 to mid-2030, 3.67 years, because a full year’s revenue roughly equals the run-rate at mid-year.
- The compute bill uses only the prospectus numbers: about $451.6 billion due by the end of 2030, and $121.3 billion in the fixed table for 2027 through 2029.
All numbers come from one Python script that follows the same method as the prompt in section 9. This is a data write-up, not investment advice.
For what the prospectus says, see this piece; for whether to buy on day one, 48 tech IPOs after the open and the unlock calendar, see this one.
The assumption I’m least sure of is the net margin. Q3’s adjusted operating margin was 15%, before stock compensation and taxes. Whether net margin can reach 20% or more by 2030, the prospectus doesn’t say, and it is the number in section 6 where one step moves the yearly return by several points.
What do you think Anthropic’s revenue will be in 2030? Reply with a number and I’ll work out the upside at your number.