Alphabet fell 10% on earnings. I tracked 61 big tech drops like it: most kept falling for a week (plus a prompt)
Is a big tech earnings drop a bargain? 61 drops of 8%+ at 8 US tech giants since 2012: usually lower a week later, no different from any day after a month.
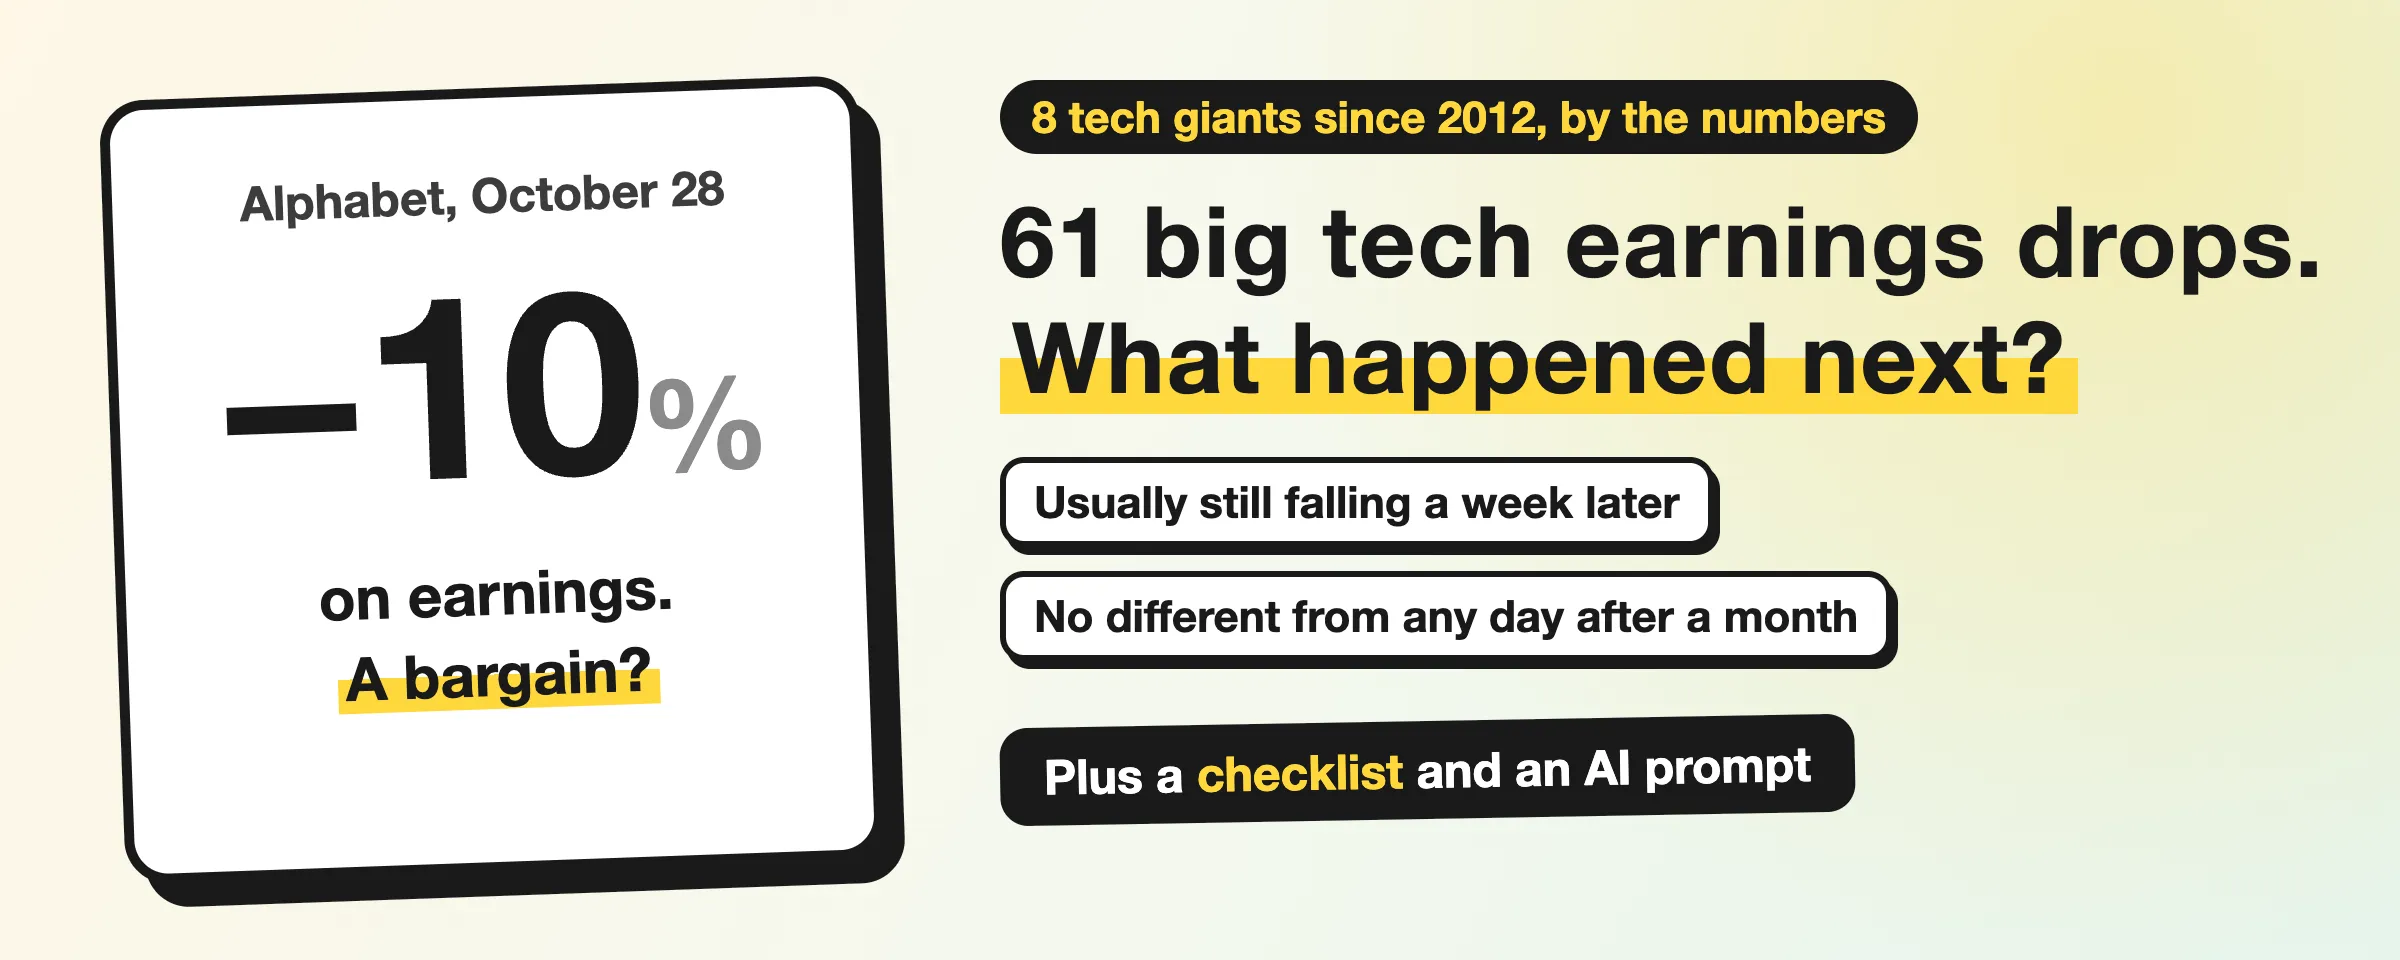
Alphabet fell 10% on earnings. Is that a bargain? I ran the numbers on every earnings drop of 8% or more at 8 big US tech companies since 2012, 61 in all: the stock usually kept falling for the first week. From one month on, buying after a drop was no different from buying on any other day.
Alphabet, Google’s parent, reported Q3 results on October 28 and fell 10% after hours (in trading after the market’s normal close). The replies split two ways. One side said “a 10% drop in a company this big is free money.” The other said “the AI bubble is starting to pop.” Both were judging by the size of the drop, and the size doesn’t tell you how it ends.
Take Meta. In February 2022 it fell 26% on earnings and was still down 22% a year later. In October that year it fell 25% again, and a year later it was up 209%. Two drops that looked alike ended 230 percentage points apart, and what decided it was what was happening at the company at the time.
The 8 are Apple, Microsoft, Alphabet, Amazon, Meta, Nvidia, Tesla and Netflix, and a drop here means the first close after the report was down 8% or more. What came next for the 61:
- A week later the median drop (line all 61 up from best to worst and take the one in the middle) was down another 1.4%. Only a third did better than the market (the S&P 500, an index of 500 large US companies) that week.
- Held a full year, 82% were up, with a median gain of 45%. That sounds like a bargain, but the same stocks bought on any day and held a year also rose a median 30%.
- Alphabet itself had only 4 drops like this in 15 years. A week later 3 were still lower; a year later all 4 were up, by 27% to 45%. Four is too few to call a pattern.
At the end there is a checklist to bookmark and a prompt that has an AI run the same method on any stock.
The 61 drops
Across 8 companies, 15 years and 534 quarterly reports, about 1 report in 9 was followed by a drop of 8% or more. They are spread very unevenly:
| Company | Quarterly reports | Drops of 8% or more |
|---|---|---|
| Tesla | 112 | 18 |
| Netflix | 62 | 15 |
| Amazon | 59 | 8 |
| Meta | 58 | 7 |
| Alphabet | 61 | 4 |
| Nvidia | 62 | 4 |
| Microsoft | 60 | 3 |
| Apple | 60 | 2 |
Tesla and Netflix account for 33 of them, so more than half of the overall tables below are about those two stocks. 6 of the 61 drops followed early numbers or a guidance cut (the company lowering its own forecast) rather than a full quarterly report: four were Tesla’s (three delivery reports, which it files with the SEC the same way as earnings, and one layoff notice with a profit outlook), and Apple and Nvidia each cut guidance once in January 2019. Take those 6 out and the conclusions hold; only the 12-month median falls from 45% to 38%.
The 5 worst:
| Date | Company | Drop day | 1 week | 1 month | 1 year |
|---|---|---|---|---|---|
| 2022-04-20 | Netflix | −35.1% | −16.6% | −18.9% | +45.0% |
| 2022-02-03 | Meta | −26.4% | −4.1% | −21.2% | −21.7% |
| 2012-07-25 | Netflix | −25.0% | −9.6% | +6.3% | +306.4% |
| 2022-10-27 | Meta | −24.6% | −9.2% | +11.1% | +209.0% |
| 2022-01-21 | Netflix | −21.8% | −3.3% | −5.1% | −8.5% |
A week, a month and a year after the drop
All 61 together, measured from the close on the day of the drop. “Vs S&P 500” is the stock’s change minus the S&P 500’s change over the same period (measured with SPY, a fund that tracks the index), so a positive number means it beat the market:
| After | Median | Share up | Median vs S&P 500 | Share beating S&P 500 |
|---|---|---|---|---|
| 1 week | −1.4% | 44% | −1.5% | 33% |
| 1 month | +1.5% | 54% | −0.5% | 46% |
| 3 months | +3.8% | 57% | 0.0% | 49% |
| 6 months | +13.1% | 69% | +3.6% | 61% |
| 12 months | +44.9% | 82% | +28.3% | 73% |
The first row is the most useful one. Selling doesn’t end on day one; it goes on for several days.
Against buying on any day
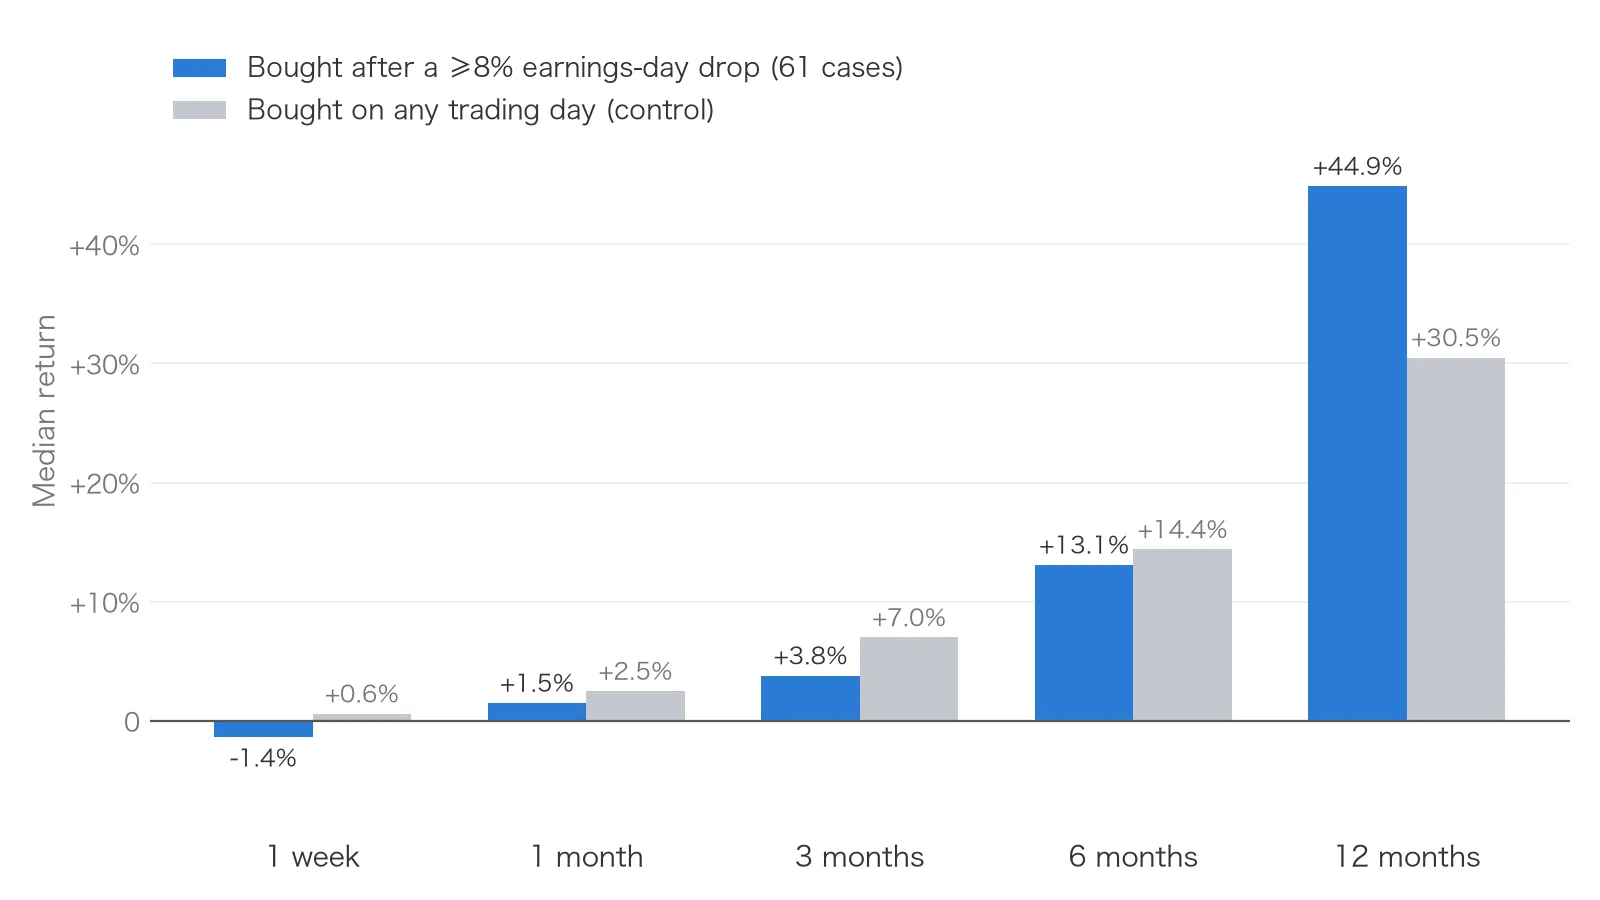
Is a 45% gain in a year good? You need something to compare it with. So I took the same 8 companies, didn’t pick the day, treated every trading day since 2012 as a buy date, and held for the same lengths of time. That is “any day”:
| After | After a drop, median | Any day, median | After a drop, share up | Any day, share up |
|---|---|---|---|---|
| 1 week | −1.4% | +0.6% | 44% | 56% |
| 1 month | +1.5% | +2.5% | 54% | 61% |
| 3 months | +3.8% | +7.0% | 57% | 66% |
| 6 months | +13.1% | +14.4% | 69% | 72% |
| 12 months | +44.9% | +30.5% | 82% | 75% |
In the one-year row, buying after a drop looks 14 percentage points better. But half of the drops are Tesla and Netflix, the two fastest risers of the 8, and they gained a lot in a year when bought on any day too. So I compared each drop with its own stock’s usual result instead (the median for buying that stock on any day and holding for the same length of time), to see whether it came out better or worse than usual.
Of the 56 drops with a full year of data, 31 came out better than their stock’s usual year, 55%. That’s a coin toss. At one month it was 46%, at three months 41%, at six months 51%.
Only the first week doesn’t look like a coin toss. Just 23 of the 61 beat their stock’s usual week, and just 20 beat the S&P 500. Toss a coin 61 times and the chance of getting only 20 heads is very small, so the gap against the S&P 500 is unlikely to be luck.
Before and after 2020
Split the 61 by date into two halves, 31 from 2012 to 2019 and 30 from 2020 to today:
| After | 2012-2019 median | 2020-2026 median |
|---|---|---|
| 1 week | +0.2% | −3.3% |
| 1 month | +2.3% | −2.2% |
| 3 months | +2.9% | +4.2% |
| 6 months | +7.7% | +16.7% |
| 12 months | +51.6% | +29.2% |
Since 2020, stocks have kept falling for a month after the drop, which didn’t happen before. By three months the two periods are back to about the same.
The data can’t say why. My guess: after-hours trading is heavy now, so people sell the evening the report comes out and the next day’s open already reflects most of it, then funds adjust their holdings slowly over the following weeks.
The later low got deeper too. For the 30 drops since 2020, the median low within three months was another 12% down, against 7.6% before 2020.
Alphabet’s own 4 drops
| Date | Drop day | 1 week | 1 month | 3 months | 1 year | 1 year vs S&P 500 | 3-month low |
|---|---|---|---|---|---|---|---|
| 2012-01-20 | −8.4% | −1.0% | +4.8% | +1.7% | +26.5% | +10.8% | −3.1% |
| 2012-10-18 | −8.0% | −2.5% | −3.6% | +6.7% | +44.9% | +22.0% | −6.9% |
| 2022-10-26 | −9.1% | −8.4% | +2.7% | +4.7% | +28.7% | +19.5% | −12.1% |
| 2023-10-25 | −9.5% | +0.7% | +8.8% | +21.2% | +31.9% | −8.7% | −2.7% |
Alphabet is one of the steadiest of the 8. Besides the 4 in the table, it fell between 7% and 8% four more times and just missed the list (April 2019, January 2024, February 2025 and July 2026, each a little past −7%).
The 2023 one rose 32% in a year and still trailed the S&P 500 by 9 percentage points, because the index rose 40% that year.
The −10% on October 28 was after hours; the official figure comes with the October 29 close. If the close is still down 8% or more, it will be Alphabet’s 5th in 15 years.
How much further it fell within three months
What a lot of people really want to know is whether buying now means buying halfway down. The data can answer half of that: from the close on the day of the drop, how much lower the low went over the next three months.
| Median | Average | Worst | |
|---|---|---|---|
| After the 61 drops | −11.2% | −12.8% | −55.4% |
| Any day | −5.9% | −9.0% | −62.1% |
At the median, the further fall after a drop was nearly double the any-day figure. Nine of the 61 fell more than 25% further from the day of the drop. The worst was Tesla’s October 2022 delivery report, down another 55% over the next three months.
What to check when a stock drops on earnings (bookmark this)
Four things the data can tell you, and one it can’t:
- In the first week after a drop, the stock usually keeps falling. Two thirds of the 61 trailed the S&P 500 that week, and since 2020 the median fell another 3.3%.
- Be ready for another 10% down. The median further low within three months was 11%, and a quarter of the time it was more than 20%.
- After a month, the drop itself tells you nothing. From then on the stock moves the way it usually does, and whether it rises depends on the company.
- Look up why it fell. The size of the drop says little. Meta’s two similar drops ended a year later at −22% and +209%. For what Alphabet fell on this time, I took its earnings filing (the 8-K) apart in a separate piece.
- The data can’t tell you which kind this one is. The 61 drops were 61 different situations, not one experiment run 61 times.
Prompt to paste into your AI
Paste this into Claude Code or Codex. It will build these tables for any set of stocks and take the earnings dates from the SEC’s public data, so you don’t have to look them up:
Help me work out how a few US stocks moved after big earnings-day drops.
1. Tickers: <separated by spaces>. Download their daily prices from Yahoo Finance from 2012 to today (closing prices adjusted for splits and dividends), and SPY for the same period.
2. Take the earnings dates from SEC EDGAR: fetch https://data.sec.gov/submissions/CIK<10-digit CIK>.json (the request needs a User-Agent header) and list every filingDate where form is 8-K and items includes "2.02", including the older records paged out under files. If a company changed its filing entity (Google was Google Inc. before 2015, for example), pull both CIKs.
3. For each earnings date D: of the two trading days D and D+1, take the one with the larger absolute change in the close as the "reaction day". A reaction day with a change of ≤ −8% counts as a big drop.
4. For each big drop, starting from the reaction day's close, calculate the change after 5, 21, 63, 126 and 252 trading days, SPY's change over the same stretch, and the difference between the two. Then calculate how far the lowest close within the next 63 trading days was below the reaction day's close.
5. Control group: for the same stocks, treat every trading day as a starting point, calculate the same windows, and take the median and the share that rose.
6. Output: (a) a table of the big drops sorted by date; (b) for all big drops, the median, average, share that rose, and change against SPY; (c) the same table for the control group; (d) each big drop compared with that stock's own usual median for the same window, the share above it, with a sign test; (e) everything split into 2012-2019 and 2020 to today.
7. Note: item 2.02 also covers guidance cuts, preliminary results and Tesla's delivery numbers. Flag records where another 2.02 was filed within 30 days, and give a table with them removed.
8. Finish with a three-sentence summary in plain English. No buy or sell advice.
Swap in other tickers to reuse it. For non-US listings the earnings dates need another source.
Two more pieces on these results came out the same day: what Alphabet fell on, read from its 8-K, and what Google’s $200B AI spend means for its users.
How I calculated this
- The 8 companies: Apple, Microsoft, Alphabet (GOOGL), Amazon, Meta, Nvidia, Tesla and Netflix. Prices come from Yahoo Finance, adjusted for splits and dividends, so they are total returns that count dividends as gains. SPY is handled the same way.
- Earnings dates come from each company’s 8-K filings on SEC EDGAR, the Item 2.02 kind (earnings announcements): 534 filings from January 2012 to October 28, 2026. The “reaction day” is whichever of the announcement day and the day after moved more. I also used the acceptance time EDGAR records to work out the first close after each announcement, and it matched for all 61. The last two filings, Microsoft’s and Alphabet’s on October 28, have no reaction day yet.
- Prices run to the October 28 close. Alphabet’s after-hours drop on October 28 is not in the tables; that waits for the October 29 close.
- These 8 are the winners as seen from today. In 2012 Tesla, Nvidia and Netflix were not giants, so every later gain in the tables runs high. The control group (the “any day” buys) uses the same 8 and carries the same bias, so look at the gap between “after a drop” and “any day,” not at the gains themselves.
- Many of the 61 bunch into the same few weeks (January to February 2022, October 2022, July 2023), so they are not 61 independent results. A few cases where Tesla, Netflix or Meta doubled pull the averages up, which is why the text uses medians throughout.
- This is a data write-up and not investment advice. If I got something wrong, tell me in the comments and I’ll fix it.
Sources:
- SEC EDGAR APIs for company filings
- Alphabet Q3 2026 8-K
- Yahoo Finance daily prices via yfinance
Have you ever bought on an earnings-day drop? Post the stock, the day, and where it stood a week and a year later. Was yours more like Meta’s first drop or its second?