Alphabet's Q3: an $8.7 billion paper loss, $265 billion in cash, $12.4 billion in stock sold (plus a prompt)
Alphabet's Q3 in plain English: the $8.7 billion loss is on paper, capex turned cash flow negative, buybacks became stock sales, search slowed to 12%.
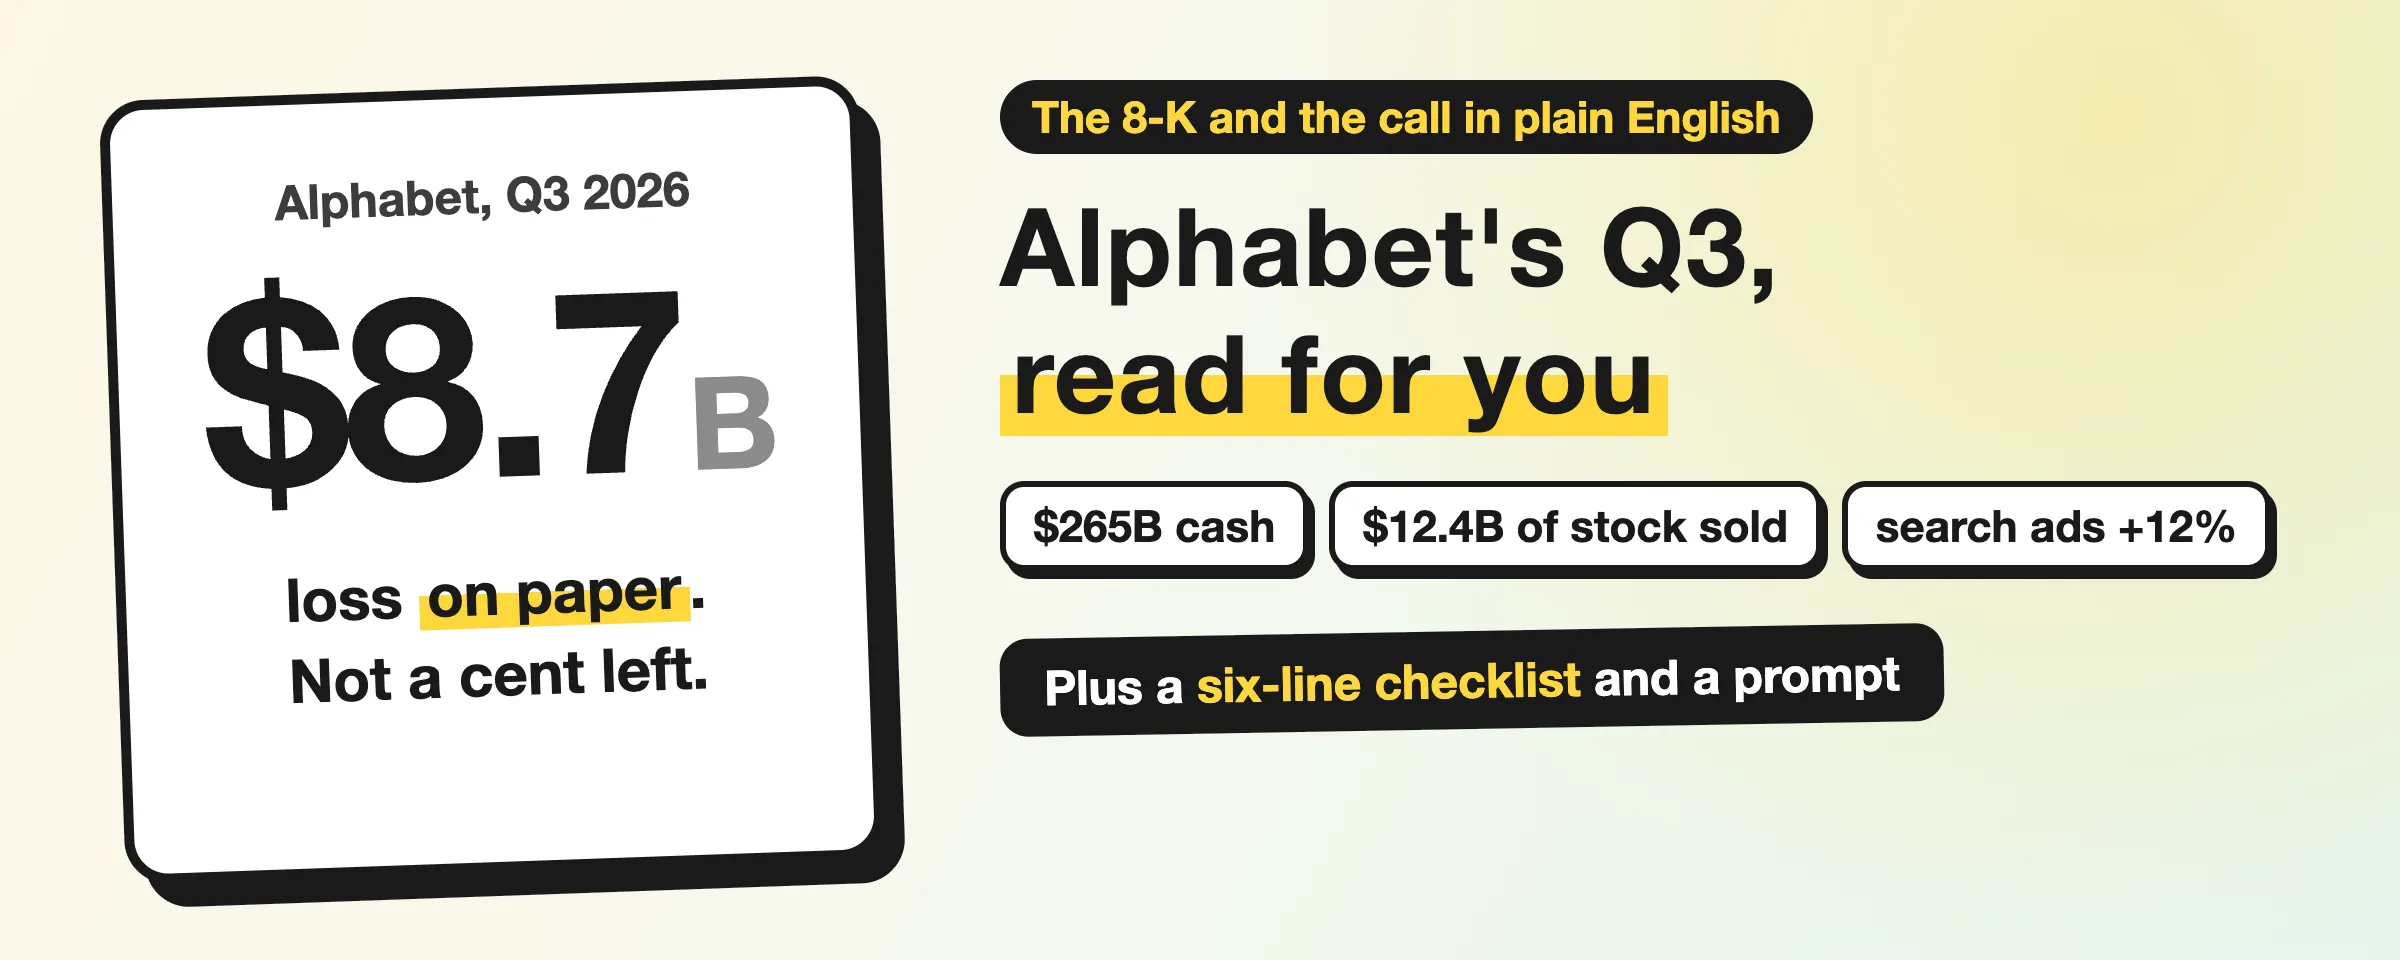
I read Alphabet’s 8-K filing with the SEC and its earnings call to explain, in plain English, what’s behind the headlines: profit plunged 24%, cash flow turned negative, the quarter missed estimates.
Alphabet, Google’s parent, reported after the US market closed on October 28. After hours the stock fell from $322 to $288, about 10%, which took roughly $400 billion off its market value overnight. Four things anyone can follow and use:
- The $8.7 billion loss is on paper. Not a cent left the company. It’s mostly its stakes in private companies such as SpaceX being marked down, the way a house can be appraised lower while you still own it. Last quarter the same line was a $98 billion gain, which is where the soaring-profit stories came from.
- Free cash flow was negative $9.1 billion because it spent $51.4 billion on chips and data centers in a single quarter. It still has $265 billion in cash and short-term securities, so it isn’t short of money.
- It stopped buying back its stock and started selling it. In the same quarter last year it bought back $11.5 billion. This year it hasn’t bought a single share, and this quarter it sold $12.4 billion of new stock. Its debt went from $21.6 billion to $125.1 billion in a year.
- What actually bothered Wall Street is search: ad revenue growth went 19%, 17%, then 12%. Cloud revenue doubled and still couldn’t make up for it.
At the end: a six-line checklist for any big tech earnings report, and a prompt that gets an AI to walk you through any company’s quarter the same way.
Where the $8.7 billion loss came from
One line to remember first, the one that records gains and losses on Alphabet’s investments. Last quarter it was a $98 billion gain, and the coverage said Google’s profit soared. This quarter it was minus $8.66 billion, and the headlines said profit plunged. When a big company’s profit suddenly doubles or halves, check this line first.
This quarter Alphabet sold $127.6 billion worth of products and services, 25% more than a year ago. The core business earned $40.6 billion (operating income), up 30%. Up to here the numbers are all good.
Net income, though, came in at $26.5 billion, 24% below last year’s $35 billion. Think of a noodle shop: operating income is what it makes selling noodles, while net income also counts how the owner’s other investments did, then takes out tax. Most of the gap is that one line, gains and losses on equity securities.
Alphabet owns stakes in some companies that aren’t listed, the big ones being SpaceX and Anthropic. Accounting rules make it revalue those stakes every quarter at the latest valuation, booking a rise as income and a drop as a loss, without selling a share or paying out a cent. On the call, the CFO said other income and expenses of negative $8.2 billion were “due primarily to unrealized loss from our investment in SpaceX.”
After tax, this cut net income by $6.7 billion, or $0.55 a share. Reported earnings per share were $2.12. Add the $0.55 back and you get $2.67, still under the roughly $3.01 analysts expected. So even without this line, the core business fell a little short.
How far negative cash flow is from running out of money
Free cash flow is one subtraction: the cash the business brings in, minus the cash spent on equipment and buildings. For a household, it’s the month’s pay after the bills, minus big purchases like a car or a new kitchen.
This quarter the business brought in $42.3 billion and spent $51.4 billion on equipment and buildings. The gap is $9.1 billion, the “negative $9.1 billion of free cash flow” in the news. The $42.3 billion is already net of a $5.2 billion fine paid to the EU, from a 2018 case that only got paid this quarter. Without the fine, the gap would be $3.9 billion.
For scale: the same quarter last year was $24 billion, so spending more than doubled in a year. The first three quarters of this year already add up to $132 billion. The company guides $195 billion to $205 billion for the full year and expects capex to “increase significantly in 2027.” It didn’t say by how much. The $300 billion figure in the media is a guess.
The money goes into land, buildings, power, servers and chips for data centers. The CFO pointed to one more drain on the call: “Operating cash flow was negatively impacted by the buildup of inventory for TPU system sales.” TPUs are the AI chips Google designs itself. Inventory went from $2.4 billion to $13.3 billion in a year.
So where did the money come from? This quarter it issued $28.7 billion of bonds and sold $12.4 billion of new stock. That’s why two headlines that seem to contradict each other, that Google’s cash flow went negative and that it has $265 billion in cash, are both true. It holds $56.3 billion in cash plus $208.8 billion in short-term securities, and free cash flow over the last 12 months still adds up to a positive $19.7 billion.
The company isn’t short of money. It is putting what it earns, borrows and raises by selling stock into data centers for AI. Whether that’s worth it, the earnings report can’t tell you.
Buybacks stopped, and it’s selling stock
Most coverage led with the profit miss and the cash burn. The ATM sale got a one-line mention.
A buyback is a company spending its own money to buy its shares back on the market. If the company is a pie, a buyback takes some slices off the table, so yours is a bigger share; selling new stock cuts extra slices, so yours is a smaller one. For the past few years Alphabet bought back more than $10 billion every quarter: $11.5 billion in Q3 last year, and $39.8 billion across the first three quarters of last year.
In the first three quarters of this year, buybacks were zero.
It’s selling stock instead. In June Alphabet announced an $80 billion equity raise and lifted it to $84.8 billion a few days later, in three parts:
- $40 billion sold bit by bit on the market through an “ATM.” About $30 billion of that pays the taxes on employee stock awards.
- $30 billion underwritten by banks, half common stock and half convertible preferred.
- $10 billion went to Warren Buffett’s Berkshire Hathaway, at $351.81 a share for Class A and $348.20 for Class C.
ATM stands for “at the market.” Picture the company on the exchange like a retail trader, putting a little new stock up for sale every day without announcing a block trade. This quarter it sold 12 million Class A shares and 24 million Class C shares that way, $12.4 billion in total, with $27.6 billion of the program still unused.
What this means for you: Alphabet has about 12.3 billion shares. The 36 million new shares sold this quarter shrink your slice by about 0.3% (that’s dilution), which is small. If the whole $84.8 billion gets sold at around $300 a share, that’s about 280 million shares, a little over 2% dilution. For years buybacks shrank the share count, and this runs the other way.
Buffett’s $10 billion went in at around $350 a share. At the after-hours $288, that’s a paper loss of about 17%. In June the coverage was all about Buffett buying Google. This time nobody brought it up.
The debt follows the same pattern. Long-term debt went from $21.6 billion a year ago to $125.1 billion. A few years ago this company’s debt was $10 billion to $20 billion. In the last year it borrowed $100 billion.
Put together, this is what analyst Luke Lango said in Fortune: “Alphabet is now funding the AI buildout with shareholders’ money instead of its own cash.”
Search slows, cloud doubles
Search ads brought in $63.4 billion, up 12%, against an analyst estimate of about $65 billion. That 12% hurt the most, because the two quarters before were 19% and 17%.
On the call, the executive who runs Google’s ads gave two reasons. FX was “the single largest driver of Search deceleration relative to Q2.” The other is that searches in AI Mode earn less from ads than traditional search.
People are searching more, and asking longer questions. Sundar Pichai said AI Mode queries are on average three times longer than traditional searches, query growth is the highest in five years, the Gemini app has reached 1 billion users, and Google’s model APIs process nearly 32 billion tokens a minute, more than four times a year ago. The same day, Google announced that ads in AI search are expanding from the US to the rest of the world.
YouTube ads brought in $11.2 billion, up 9%, also a little under expectations.
Cloud revenue was $30.7 billion, double last year, with $11.1 billion in profit, a 36% margin. Contracts already signed but not yet booked as revenue, like a builder’s signed jobs that aren’t finished yet, total $561 billion, and the company says more than half will become revenue within two years. Analyst Dan Ives said, “This is the Cloud print we have been waiting for.” Another analyst said Cloud did its job, and “the problem is everything else.”
Google now sells whole TPU systems to other companies. Customers used to get Google’s TPUs by renting computing power on Google Cloud. This year Google started selling complete TPU systems for installation in customers’ own data centers or third-party ones. This quarter’s 8-K, for the first time, named TPU system sales “a meaningful contributor” to Cloud’s revenue growth. The CFO expects them to keep scaling in Q4, “followed by a meaningful revenue ramp in 2027,” and said Google is “selling much more than just a chip,” meaning a whole system built for the job. Reports say OpenAI plans to buy Google’s chips; neither company has confirmed it.
Microsoft reported the same day. Azure grew 48%, beating expectations, and the stock rose about 4% after hours. Both are spending heavily on AI, yet one stock went up and the other went down. The market saw Microsoft’s spending already showing up as faster revenue growth, while search, the business Google lives on, is slowing.
Six lines to read first in any big tech earnings report (bookmark this)
Next time a tech company reports and the headlines say soaring or plunging, open its 8-K or press release and find these six lines:
| Line | Why it matters | Alphabet this quarter |
|---|---|---|
| Revenue and growth | How much it sold, and how fast sales grew | $127.6 billion, +25% |
| Operating income | What the core business earned, leaving out investments and tax | $40.6 billion, +30% |
| Other income (expense) | Its investments’ paper gains and losses, unrelated to the core business | -$8.2 billion, mostly SpaceX |
| Capex | What it spent on equipment and buildings | $51.4 billion, vs. $24 billion a year ago |
| Buybacks and share sales | Buying its stock back (your slice grows) or selling new stock (your slice shrinks) | Buybacks $0, stock sold $12.4 billion |
| Growth of the biggest business line | Is the business that pays the bills slowing down | Search +12%, after 19% and 17% |
One pattern to remember: net income and earnings per share are the numbers most easily thrown off by the other income line, so judge the core business by operating income. When cash flow is negative, read it next to the cash on hand, then check whether the gap was filled by borrowing or by selling stock.
Prompt to paste into your AI
On the SEC site, open a company’s latest 8-K (the earnings one, Item 2.02) and save the page into an empty folder. Open Claude Code or Codex in that folder and paste this:
Read a US quarterly earnings release for me (the press release and financial tables attached to the 8-K) and explain it to someone with no finance background. The files are in the current folder.
1. First list these 6 lines, each with this period's number, the same period last year, and the change: revenue; operating income; other income/loss; capital expenditure; share buybacks and new share issuance; the business line with the most revenue.
2. Of the change in net income and earnings per share, how much comes from "other income/loss" (investment revaluations, currency effects and other paper items)? Leaving that out, did profit from the core business go up or down?
3. Calculate free cash flow: cash from operating activities minus capital expenditure. If it is negative, list the company's cash and short-term securities, then find whether the gap was filled by issuing debt or by selling stock, and how much of each.
4. List the company's guidance for next quarter or the full year on capital expenditure, revenue and margins, quoted word for word.
5. Find what in the call or the press release matters to ordinary users: product user numbers, price changes, new businesses, businesses shut down.
6. After each item, quote the exact sentence from the filing. If the filing doesn't say, write "not stated". Don't guess.
7. End with three plain sentences: is the core business doing well, where is the money going, and is the company short of cash.
For another company, swap in its file and run it again.
Thinking of buying this dip? I checked how big tech stocks did after past earnings-day drops. Don’t own the stock and just use Google’s products? Read what the AI spending means for you.
How I read it
- The numbers come from Exhibit 99.1 of the 8-K Alphabet filed with the SEC on October 28, 2026, and the transcript of that day’s earnings call. Estimates are the analyst consensus quoted in the media. Sources differ: EPS estimates range from $2.99 to $3.30, and I used $3.01.
- SpaceX as the main source of the $8.2 billion loss comes from the CFO on the call. The 8-K table only has a line for losses on equity securities, with no breakdown.
- Stock price and market value: close $322.22, after-hours low $288.35. The after-hours drop runs from 8% to 11% depending on the data source. The 12.3 billion share count, the dilution figures and Buffett’s paper loss are my own rough math from market value and share price; the company didn’t publish them.
- The $300 billion for 2027 capex is a media estimate. The company only said it will “increase significantly.”
- This is a write-up of an earnings report and not investment advice. If I got something wrong, tell me in the comments and I’ll fix it.
Sources:
- Alphabet Q3 2026 8-K, Exhibit 99.1
- Alphabet Q2 2026 8-K, Exhibit 99.1
- June 2026 equity raise announcement, 8-K
- Q3 earnings call transcript (Investing.com)
- Fortune: cloud revenue doubles, free cash flow turns negative
- The Information: $12.4 billion of stock sold through the ATM program
- TechCrunch: Google takes AI search ads global
- CNBC: Microsoft’s earnings the same day
Who gets the blame for the roughly $400 billion in market value lost overnight: the $8.7 billion paper loss, that 12% in search, or buybacks turning into stock sales?