Stocks rose after all 19 midterms since 1950, by 15% on average. I ran 76 years of data: the last six averaged 9%, about the same as buying on any other day (plus a year-by-year table and a prompt)
S&P 500 after 19 midterms since 1950: the 15% average comes from old years, the last 6 averaged 9.3%, and most of the extra gain came in the first 6 months.
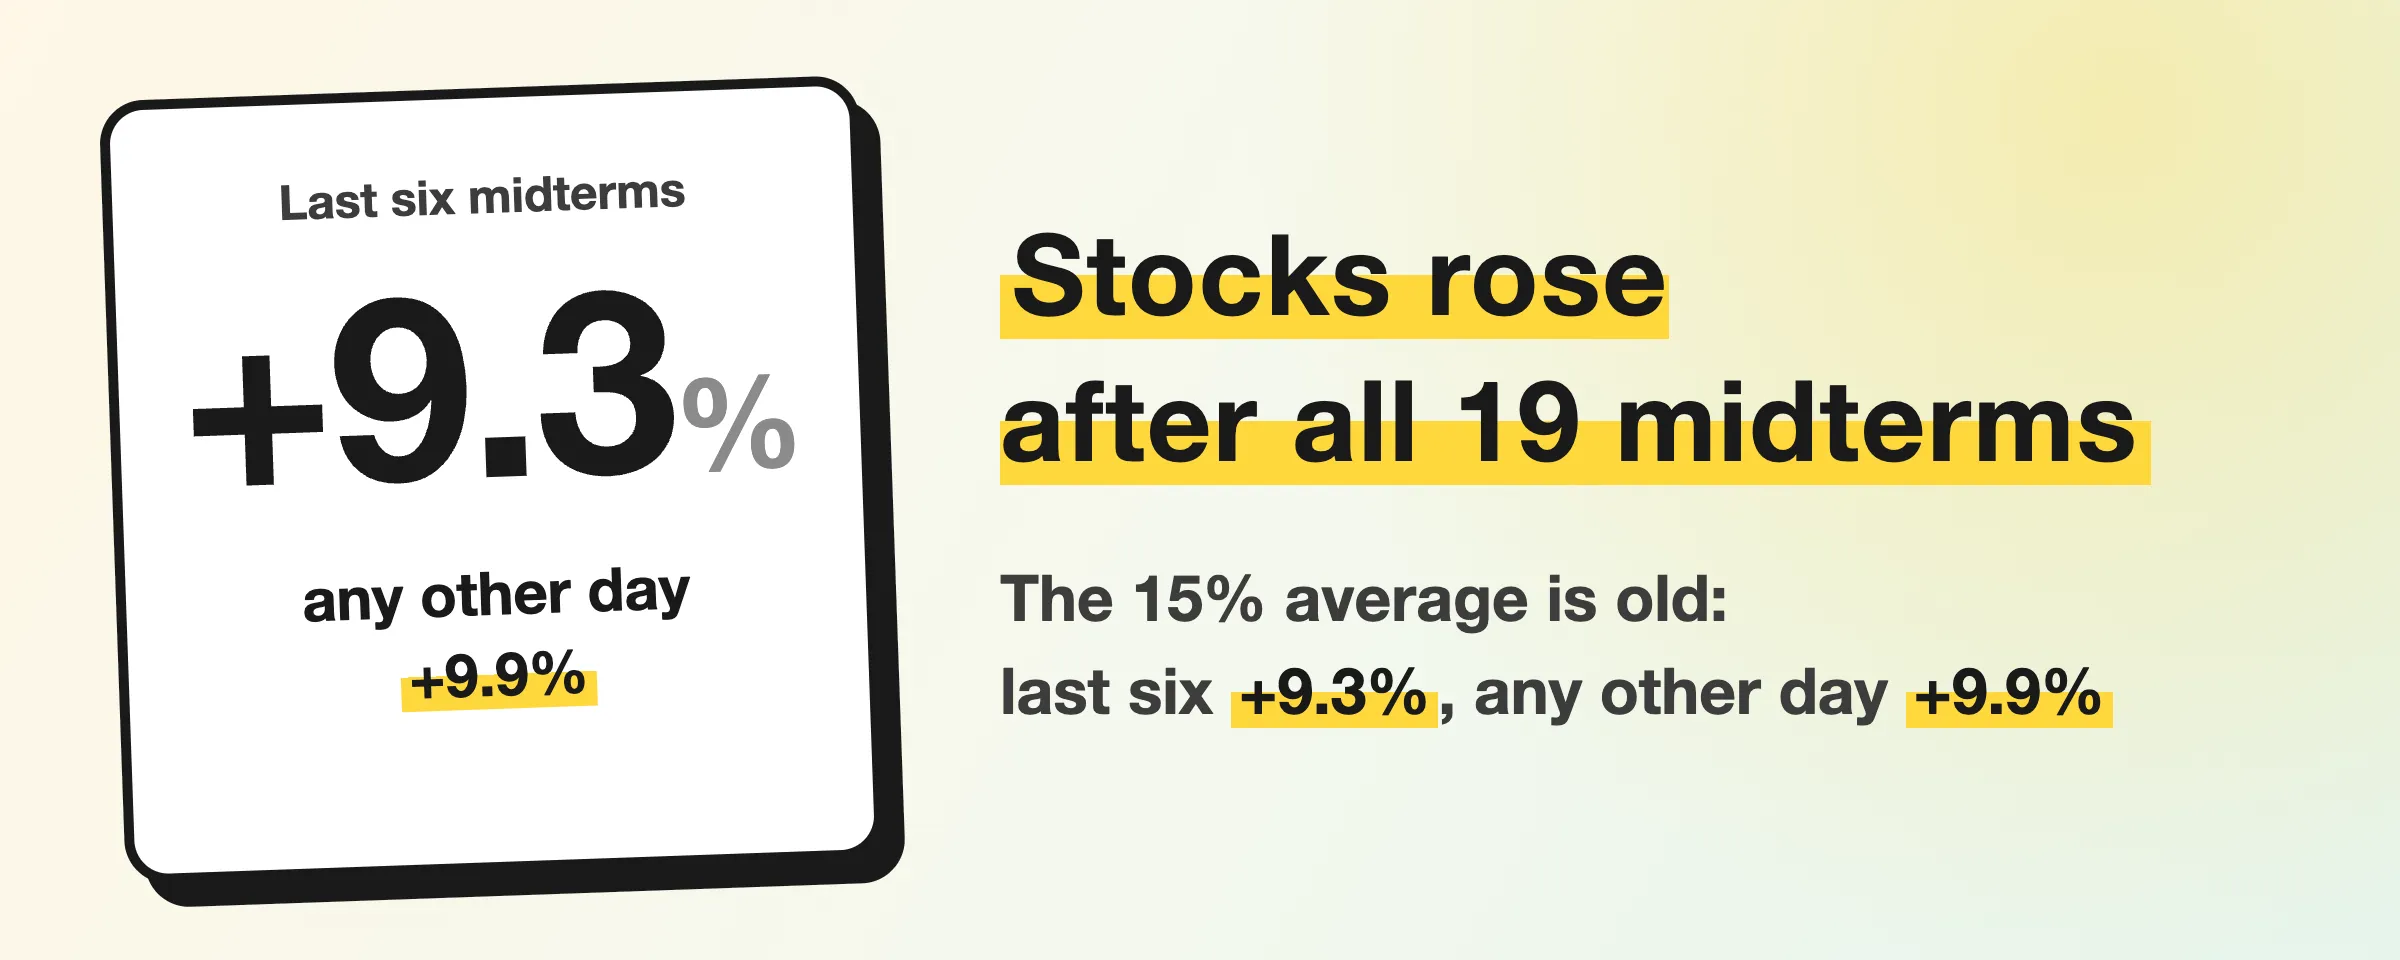
Going into the November 3 midterms, one number was everywhere: after all 19 midterms since 1950, the S&P 500 rose over the next 12 months, by 15% on average.
I reran it from daily prices. All 19 rising is real, and the average is +15.3%. But you can’t use it as it stands. Taken apart:
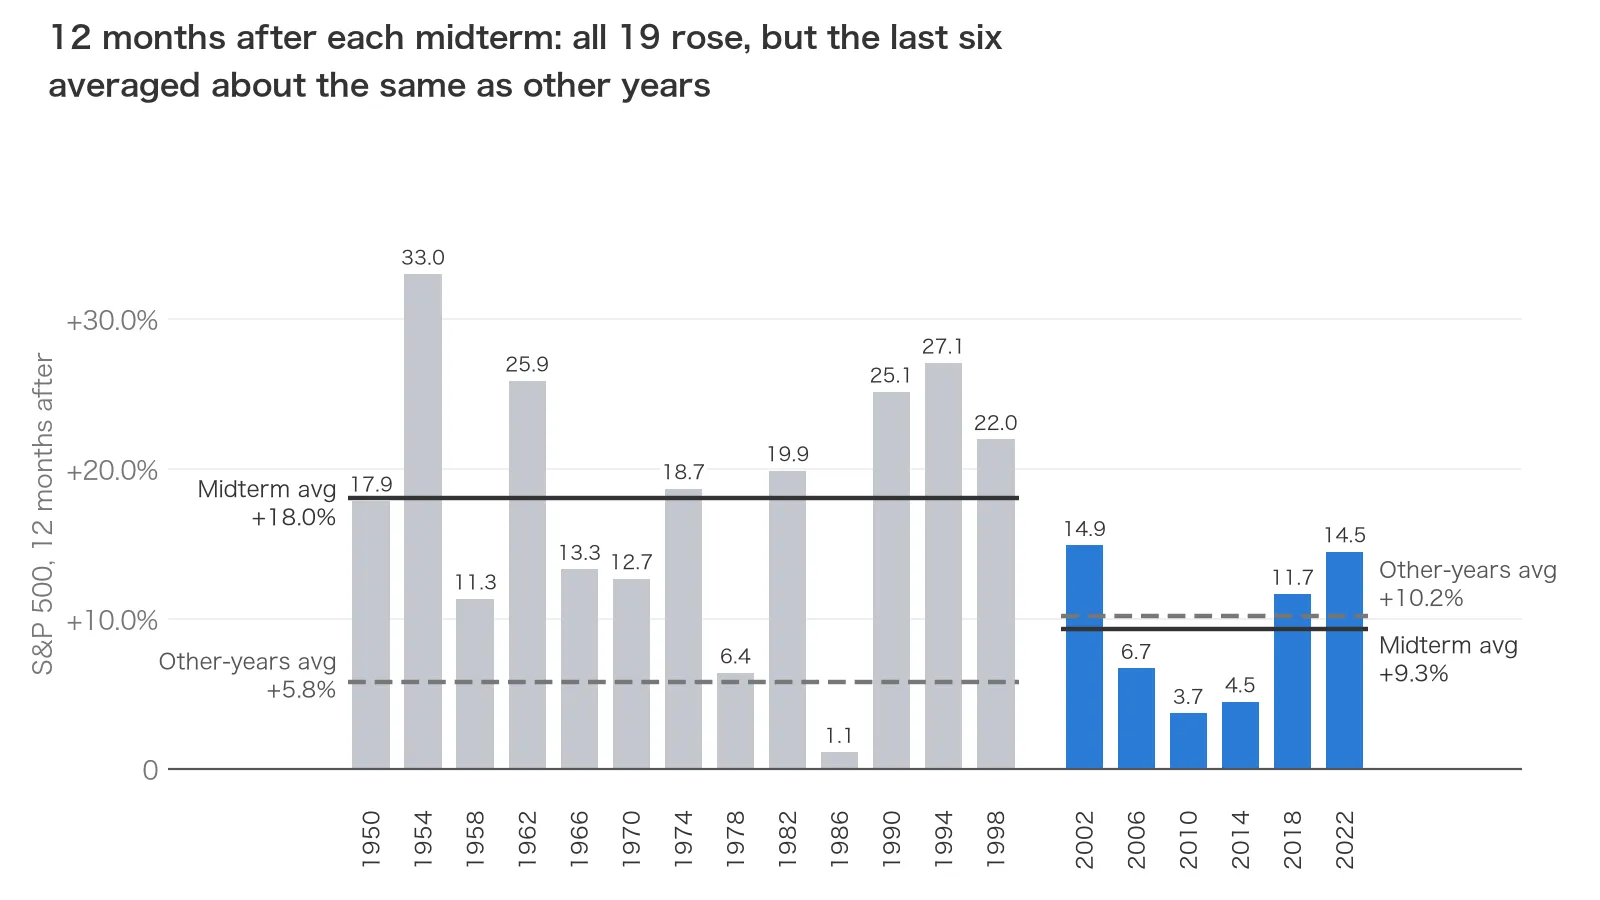
- 15% is an old number. The last 6 midterms, 2002 on, averaged +9.3%. Buying on a random day in the same stretch and holding 12 months averaged +9.9%.
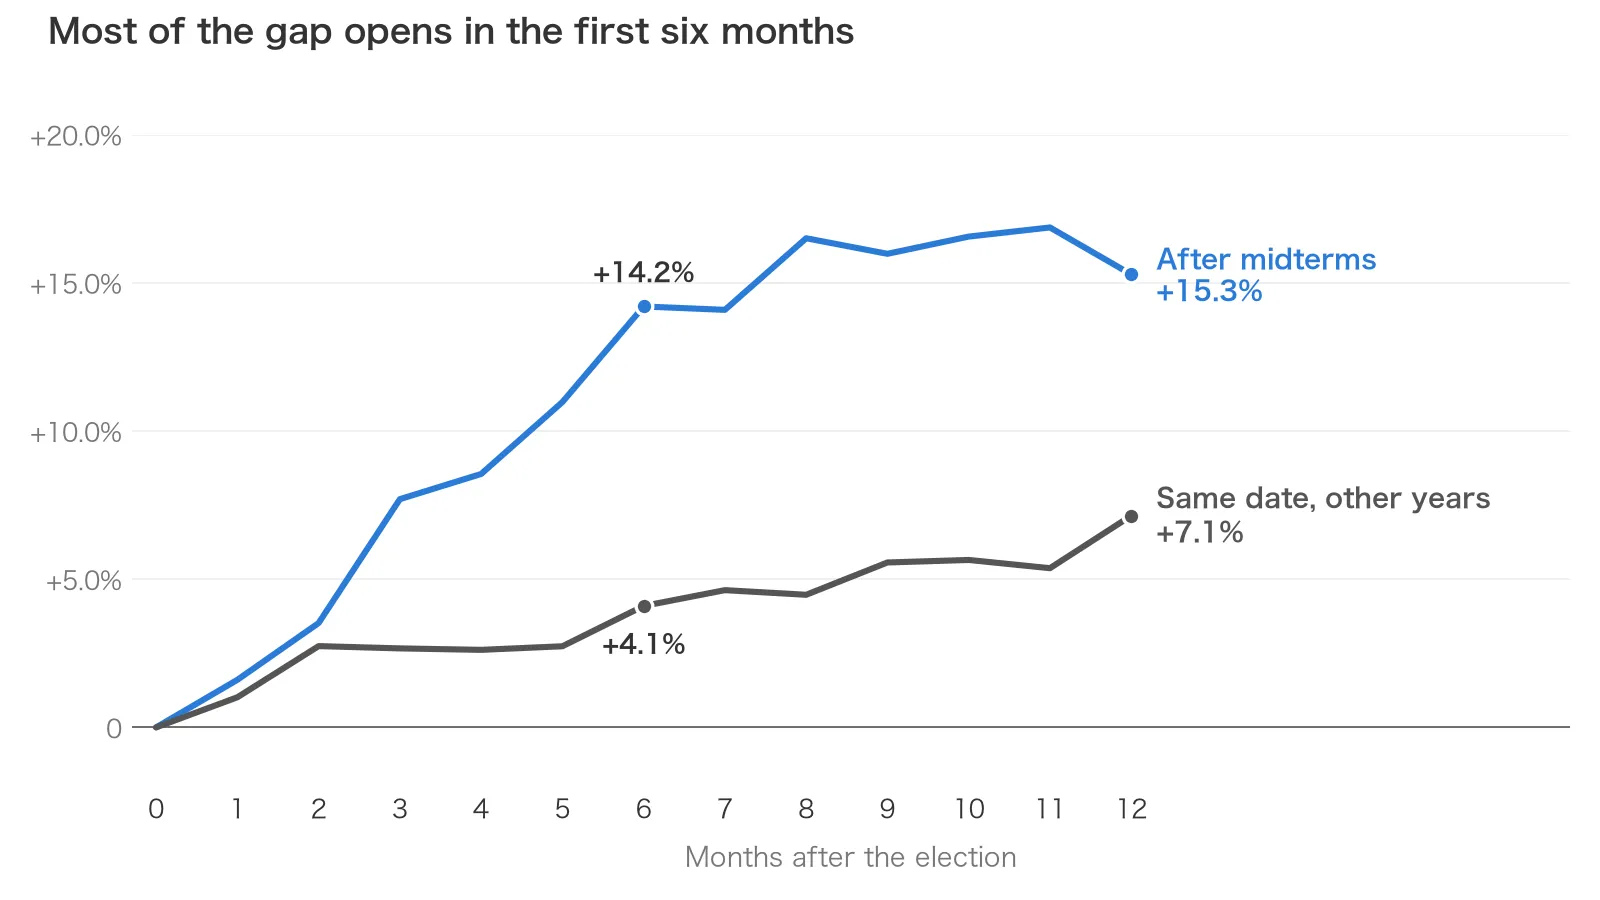
- The extra gain came mostly in the first 6 months. Those averaged +14.2%, against +4.1% for other years from the same date. The second 6 months gave +1.1% against +2.6%, hard to tell apart. The first month shows little edge either.
- All up still means sitting through losses. Buying on election day, 3 times you were down more than 10% at some point. The 1986 midterm landed before the 1987 crash and returned just 1.1% for the year.
- Whether Congress changes hands shows no stable difference. When the House flipped (6 times), the 12-month average was +16.1%. When it didn’t (13 times), +14.9%.
- One thing about this year differs from all 19: valuation. The Shiller P/E was 40.7 in early October, higher than before any of them.
Below: the year-by-year table of all 19 and a prompt. Paste it into an AI whenever you see an “N out of N” stat and it will check the claim.
1. The 15% average is an old number
| Period | Midterms | Average over the next 12 months | Other years, same date |
|---|---|---|---|
| 1950 to 2001 | 13 | +18.0% | +5.8% |
| 2002 to 2025 | 6 | +9.3% | +10.2% |
The last 6 still all rose, but other years did well in that stretch too: 14 of 17 went up. The 15% average is pulled up by old years like 1954 (+33.0%) and 1994 (+27.1%).
I picked 2002 as the cut. Use the last 4 instead and you get +8.6% (other years +14.8%). Use the last 8 and it’s +13.1% (other years +9.3%). The 12-month gap changes sign, and neither is bigger than luck alone could produce. Six samples can’t prove the edge is gone, and 15% isn’t something to expect either.
Other indexes ended up far apart, also over 12 months:
- Nasdaq: 13 midterms since 1974, average +25.3%, median +18.9%. Only 1986 fell (−11.6%).
- Russell 2000 (small caps): 9 midterms since 1990, average +14.2%, median only +2.9%. None of the last 5 beat 3%.
2. The extra gain came mostly in the first 6 months
| After the election | Average | Median | Times up | Worst | Other years, average |
|---|---|---|---|---|---|
| Next day | +0.6% | +0.6% | 15/19 | −2.1% | −0.1% |
| 1 month | +1.6% | +2.3% | 15/19 | −12.0% | +1.0% |
| 3 months | +7.7% | +7.6% | 17/19 | −7.8% | +2.6% |
| 6 months | +14.2% | +17.0% | 19/19 | +1.2% | +4.1% |
| 12 months | +15.3% | +14.5% | 19/19 | +1.1% | +7.1% |
| 24 months | +27.1% | +28.2% | 18/19 | −32.7% | +16.3% |
“Other years” means every non-midterm year since 1950, counted from the same calendar date. The median is the middle result.
For the first 2 months the two lines run together, and in 1974 the market fell 12% in the month after the election. The gap opens in month 3, reaches 10 points by month 6, and stays between 8 and 12 after that. In the second 6 months only 11 of 19 midterms rose, and I can’t tell that apart from other years.
I shuffled the 76 years at random and regrouped them 100,000 times. A first-6-month gap this large came up by luck about once in 10,000, the firmest result in the whole data set. It is shrinking too: before 2002 it was +17.4% against +3.8%, since then +7.3% against +4.8%.
3. Buying on election day: how far down did it go?
“All 19 up” only looks at the endpoint. Here is the lowest close along the way, against the election-day close:
- 10 times it fell less than 2%, and in 1954 and 1998 it never fell below the starting level.
- 6 times it fell more than 5%: 1974, 1986, 2002, 2010, 2014, 2018.
- 3 times it fell more than 10%: 1974 at −13.4%, 2002 at −12.5%, 2018 at −14.7%.
In 2018 the market rose 2.1% the next day, hit −14.7% on Christmas Eve seven weeks later, and was still +11.7% a year on. In 1986 it climbed until August 1987, up as much as +36.8%, then the crash took 33.2% off the peak, and the year ended at +1.1%.
A 12-month win doesn’t cover the longer run either. The 2006 midterm gave +6.7% at 12 months and −32.7% at 24, with the financial crisis in between.
4. When Congress changes hands
| Outcome | Times | Next day | 6 months | 12 months |
|---|---|---|---|---|
| House flipped | 6 | +0.4% | +11.6% | +16.1% |
| House didn’t flip | 13 | +0.6% | +15.4% | +14.9% |
| Democratic president | 9 | +0.3% | +13.5% | +15.0% |
| Republican president | 10 | +0.8% | +14.8% | +15.5% |
6 against 13 is too small to show a stable difference: the gap is almost 4 points at 6 months and down to about 1 point at 12.
The president’s party has lost both chambers only 3 times: 1954, 1994 and 2006. At 12 months that was +33.0%, +27.1% and +6.7%; at 24 months, +46.3%, +56.9% and −32.7%. Three samples show no pattern.
5. Which past years look like this one
The S&P 500 closed at 7,541.40 on November 2, up 10.2% for the year and 3.5% below its record close of 7,818.93 on October 6.
This year’s largest drawdown (the fall from a high) was −9.1%. The median before a midterm is −16%, so this year’s is much shallower. The three years with the closest drawdown:
| Year | Drawdown before the election | 6 months | 12 months | Lowest along the way |
|---|---|---|---|---|
| 1994 | −8.9% | +12.5% | +27.1% | −4.3% |
| 1986 | −9.4% | +17.5% | +1.1% | −8.7% (1987 crash) |
| 2018 | −10.2% | +6.4% | +11.7% | −14.7% |
A year later they range from +1% to +27%. History doesn’t give a level for this year.
This year’s low was about 6,344 on March 30, and the market gained 18.9% from there to November 2. Across the past 19, the median gain from that year’s low to election day was +16.2%. Only in 2018 did the market break that year’s low after the vote.
Valuation is where this year differs most. The Shiller P/E (the price-to-earnings ratio on the past 10 years’ average profits) was 40.7 in early October. The highest before any of the 19 elections was 33.8, in 1998. Stocks rose 22% in the 12 months after 1998, and the dot-com bubble began to burst a few months later. Across the 19, valuation shows no relationship with the next 12 months (correlation −0.13).
6. One stat, five different numbers
| Who | Starting year | Window | Result |
|---|---|---|---|
| Motley Fool | 1874 | 12 months from election day, dividends included | 32 of 38 up, average 14% |
| Fidelity | 1938 | 12 months after the election | 95% up; average about 14% |
| JPMorgan | 1950 | 12 months | all 19 up, average 15.1% |
| 24/7 Wall St. | 1950 | the calendar year after the election, dividends included | all 19 up, average 20.9% |
| Mine | 1950 | 12 months from election day, no dividends | all 19 up, average 15.3% |
Most of the gap comes from the start year, the window and whether dividends count. Next time you see an “N out of N” stat, ask these five questions (worth bookmarking):
- Counted from which year? From 1950 it’s 19 of 19. From 1942 it’s 21 of 21 (1946 rose only 0.8%). Go back further and 1938 fell 4.5%, 1930 fell 38.7%.
- How is the window set? I moved the start to September 1, October 1, December 1, January 1 or February 1, and every one has down years. But starting on the first of any month from August to the following February, the 12-month average stays between +13% and +20%, against +6% to +8% for other years, so the extra return doesn’t start on election day.
- What is the comparison? Buy on any day and hold 12 months and you’re up 75% of the time, with a +9.5% average.
- How many cuts were tried? A presidential term has four years, and writing up only the best one is already picking. With a 74.7% chance of rising and each midterm treated as independent, 19 in a row is about 1 in 255. On average gain, shuffling the years and taking the best group reaches +15.3% about 9% of the time.
- Does it still hold lately? Cut out the recent events and slice a few more ways. Here the last 6 look like other years over 12 months and the last 8 beat them by 4 points. Neither settles it.
A prompt to paste into an AI
Use an AI that can browse and run code, such as Claude Code or Codex:
Help me verify a market statistic. Run code on real data and don't answer from memory.

The claim, word for word: ______ (for example: "After every US midterm election since 1950, the S&P 500 was higher 12 months later, 19 times out of 19")
The ticker: ______ (for example: ^GSPC, QQQ)

Steps:
1. Use Python's yfinance to download daily closing prices for the ticker. Print the start and end dates and say whether dividends are included. If the claim uses a different basis, point it out.
2. List every event date the claim covers and state the date rule. Use the close on the event day, or the last close before it, as the starting point, and count windows in calendar months. Put every result in a table.
3. Compare your table with the claim: the count, the average, and whether any event fell. If they don't match, say so plainly.
4. Run five checks. Give numbers and sample sizes for each:
   - Start year: move the first year forward and back by 10 and 20 years. Does the conclusion hold?
   - Window: move the start date 1 and 2 months either way, then split the window into a first half and a second half. Does the conclusion hold?
   - Comparison: over the same window, what are the average and share of gains for non-event years counted from the same date? And for buying on any day?
   - Selection: was this group picked from several candidates? Name the similar groups (for example, the four years of a presidential term) and compute them all. Then shuffle the group labels 10,000 times and report how often the best group reaches this average.
   - Recency: compute the most recent third of events on their own, then cut once more and once less. Is there still a gap against other years over the same period? Does the conclusion change?
5. For each event's holding period, find the lowest close relative to the starting point and tell me the worst loss along the way.
6. End with a three-line conclusion: what holds up, what doesn't, and whether the number can be used as an expectation. If the sample is small, say it is small. Don't give buy or sell advice.
The year-by-year table for all 19 (bookmark it)
S&P 500 price changes, dividends not included. “Lowest along the way” is the lowest close in the following 12 months against the starting point. R and D are the president’s party.
| Year | President | Congress | Next day | 1 month | 6 months | 12 months | Lowest along the way |
|---|---|---|---|---|---|---|---|
| 2022 | D | House flipped | −2.1% | +3.5% | +8.1% | +14.5% | −2.1% |
| 2018 | R | House flipped | +2.1% | −2.2% | +6.4% | +11.7% | −14.7% |
| 2014 | D | Senate flipped | +0.6% | +3.0% | +5.1% | +4.5% | −7.2% |
| 2010 | D | House flipped | +0.4% | +2.3% | +14.0% | +3.7% | −7.9% |
| 2006 | R | Both flipped | +0.2% | +1.8% | +9.2% | +6.7% | −0.6% |
| 2002 | R | Senate flipped | +0.9% | −1.0% | +1.2% | +14.9% | −12.5% |
| 1998 | D | No flip | +0.7% | +3.5% | +21.9% | +22.0% | never below |
| 1994 | D | Both flipped | −0.1% | −4.3% | +12.5% | +27.1% | −4.3% |
| 1990 | R | No flip | −1.8% | +5.6% | +22.0% | +25.1% | −1.8% |
| 1986 | R | Senate flipped | +0.2% | +2.8% | +17.5% | +1.1% | −8.7% |
| 1982 | R | No flip | +3.9% | +1.0% | +17.9% | +19.9% | −3.3% |
| 1978 | D | No flip | +0.6% | +3.4% | +5.5% | +6.4% | −1.4% |
| 1974 | R | No flip | −0.5% | −12.0% | +19.9% | +18.7% | −13.4% |
| 1970 | R | No flip | +0.2% | +5.6% | +22.6% | +12.7% | −1.7% |
| 1966 | D | No flip | +0.8% | +1.2% | +17.0% | +13.3% | −1.3% |
| 1962 | D | No flip | +0.6% | +6.9% | +20.0% | +25.9% | −0.1% |
| 1958 | R | No flip | +0.9% | +1.9% | +11.8% | +11.3% | −1.0% |
| 1954 | R | Both flipped | +2.0% | +6.9% | +19.4% | +33.0% | never below |
| 1950 | D | No flip | +1.0% | +0.5% | +17.6% | +17.9% | −1.9% |
How I calculated this
- Prices: Yahoo’s ^GSPC daily close, no dividends. Before 1957 it’s the S&P 90 index. With dividends added and inflation taken out, only 1978 was negative (−0.5%) and 1986 broke even.
- Starting point: the close on election day, or the last close before it. Through 1966 the NYSE was shut on election day, so I used the previous day’s close. Windows count calendar months.
- Other years: every non-midterm year from 1950 to 2025, from the same date rule (57 years, leaving out any window that hasn’t finished).
- Checks: from November 2016 on, I compared against FRED day by day; the largest gap is 0.12%. Nasdaq event dates are all within 0.5% of FRED. Earlier S&P closes match FMP’s to the cent (the two may share a source; FMP dates 45 rows in fall 1955 and 1956 a day early), and against Shiller’s monthly data, only July 1974 out of 900-plus months differs by more than 0.5%. I also had an AI that had never seen this code run the prompt above from scratch, and its 6-month, 12-month and lowest-along-the-way figures matched all 19 rows.
- Congress control: the House and Senate historical party-division tables.
- Limits: only 19 samples, fewer in each sub-group, and I chose the 2002 cut after seeing the data. This year’s Shiller P/E uses early-October prices; past years use the monthly average.
- This is a historical statistic, not investment advice.
Which does this year look like to you: 1994, 1986 or 2018? Tell me in the comments. If you think “the last 6” is an unfair cut, post your cut and the numbers it gives, and if I got it wrong I’ll fix it. Bookmark this, and the next time someone tells you “N out of N,” run it through the five questions.
Sources: JPMorgan (via Moneywise on Yahoo Finance), Fidelity, Motley Fool, 24/7 Wall St., US House, US Senate.